Software Name:
Nevron Vision for SharePoint
Version: 2022.1
Category: Business
Date Listed/Updated: 2022-10-19 18:17:38
File size: 124827 KB
OS: Win2000,WinXP,Win7 x32,Win7 x64,Windows 8,Windows 10,WinServer,WinOther,WinVista,WinVista x64
License: Other Price($): 1699
Author/Publisher name: Nevron Software
View Full Screenshot
Description: Nevron Data Visualization technology for Microsoft SharePoint is designed to provide exceptional reporting and dashboarding features to SharePoint users and IT Professionals. The web parts included in the suite are configured visually and directly in SharePoint environment, through an exhaustive web-based interface.
The web parts can connect to a diverse range of data sources including: databases, SP Lists, BDC and Excel Services. They are equipped with a fast, reliable and flexible data aggregation engine, allowing the authoring of complex dashboards that perform sophisticated data analysis. This, combined with the presentation quality and rich feature set that only Nevron provides, makes these web parts unmatched.
Nevron SharePoint Vision is a turn-key solution for every SharePoint user who is willing to create advanced digital dashboards and reports in SharePoint - quickly, on budget and on time.
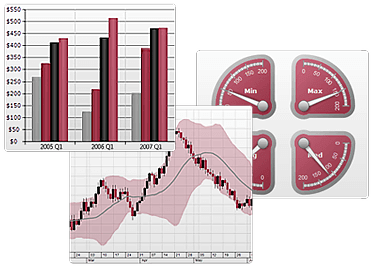
Nevron Chart for SharePoint is an advanced web part, delivering a complete set of 2D and 3D charting types, highly customizable axes, multiple charting areas, legends and titles and a full range of enterprise charting features, driven by pivot data aggregation. This allows the creation of complex pivot charts to be done visually and directly in SharePoint environment.
Nevron Gauge for SharePoint also delivers a complete set of radial and linear gauges, numeric displays and state indicators. This makes possible the modification of complex gauges, tightly integrated with your data, which are manipulated visually and directly in SharePoint environment.
Nevron Map for SharePoint is designed to provide an easy and powerful way to create choropleth maps that are tightly integrated with your data. The web part delivers an unmatched set of features related to visual quality, layout, data integration and data analysis.
Nevron Barcode for SharePoint delivers a powerful way to display data driven linear and matrix barcodes.

 We have affiliation with number one software market place Share-IT\. Contact us for better pricing/customised coupon code
 Use Avangate Coupoun code 548AAC3EB7 to get maximum discount. Please contact through skype: softrevu or send mail to submit@softrevu.com for better pricing
EULA
Tags: SharePoint SharePoint charts SharePoint chart chart sharepoint moss chart chart web part dash
Is this software spam? Report Spam
Software removal request by publisher Removal Request
Software Review: Nevron Vision for SharePoint Review
For publisher: Request Software Confirmation
Press release from the publisher:Nevron Software announces the official release of Nevron Vision for SharePoint 2022.1.
Following the promise for feature-rich and advanced data visualization for SharePoint, Nevron releases Vision for SP 2022.1. The best charts, gauges, barcodes, and maps for SharePoint are now enhanced with great new features. Check out the information below for all new additions which will help you create advanced dashboards for your SharePoint pages.
Following is a summary of the new features introduced by the 2022.1 release:
Enhancements to Nevron Chart for SharePoint< b>
New Ternary Char Type< b>
This feature allows you to display Ternary Point and Ternary Bubble series inside a ternary chart. A ternary chart is type of plot on three variables that sum to a constant.
New Point Series Dropline< b>
The Point Series now support drop lines. Drop lines are lines that extend from the point X, Y, Z value to the chart walls. Optionally drop lines can extend to the axis Min, Max value, or to a user-specified value (drop lines origin).
New Bar Connect Lines< b>
The Bar Series now support connector lines between adjacent bars.
New Float Bar Connector Lines< b>
The Float Bar Series now support connector lines between adjacent bars begin end values.
New Heat Map Contour Lines< b>
The Heat Map Series supports annotated contours. The user can specify the formatting of the contour value (elevation). The distance between labels along the contour, whether the orientation of the labels must follow the contour slope, whether the label should clip the contour line it annotates, and others.
Time Span Scale< b>
This type of scale allows you to display the duration of time (time span) (usually on the X-Axis). The duration is specified in time spans or ticks.
Visit https: www.nevron.com to find out more about the amazing new features and download the latest software.
Visit the Press Release for more details
Software from the publisher:Nevron User Interface for .NET, Nevron .NET Vision 2009_Vol.1, Nevron Diagram for .NET 2009_Vol.1, Nevron Chart for .NET 2009_Vol.1, Nevron Draw, Nevron Barcode for SharePoint, Nevron Barcode for SSRS, Nevron Chart for SharePoint, Nevron Chart for SSRS, Nevron Gauge for SharePoint, Nevron Gauge for SSRS, Nevron Map for SharePoint, Nevron Map for SSRS, Nevron Vision for SharePoint, Nevron Vision for SSRS, NOV Chart for .NET, NOV Schedule for .NET, NOV Diagram for .NET, Nevron Calendar for Windows, Nevron Vision for .NET, Nevron Chart for .NET, Nevron Diagram for .NET,